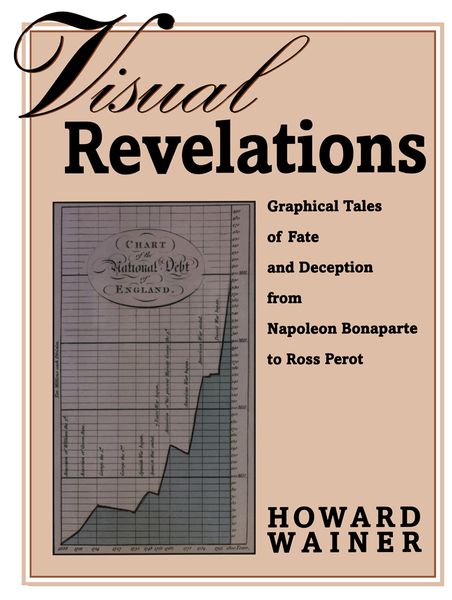

Visual Revelations Graphical Tales of Fate and Deception from Napoleon Bonaparte to Ross Perot
-
- Taschenbuch ausgewählt
- eBook
-
Sprache:Englisch
Fr. 78.90
inkl. gesetzl. MwSt.,
Beschreibung
Produktdetails
Einband
Taschenbuch
Erscheinungsdatum
06.10.2011
Abbildungen
14 Illustrations, color
Verlag
Springer UsSeitenzahl
180
Maße (L/B/H)
27.9/21/1.2 cm
Gewicht
511 g
Auflage
Softcover reprint of the original 1st edition 1997
Sprache
Englisch
ISBN
978-1-4612-7486-5
This extraordinary book provides a journey through the jungle of good and bad graphical devices used to illustrate and obfuscate data. The diversity of examples is tremendous: ranging from Napoleon's retreat from Moscow to the O-rings on the space shuttle and from mortalities in hospitals to the schedules of buses. The author's aim is to illustrate how effectively a well-chosen graphic can reveal in an instant the essential truth behind some data whilst a poorly designed representation can conceal an awful truth. As well as providing numerous examples of both, the author includes plenty of helpful ideas to make us all better producers and consumers of graphics.
Kundinnen und Kunden meinen
Verfassen Sie die erste Bewertung zu diesem Artikel
Helfen Sie anderen Kund*innen durch Ihre Meinung