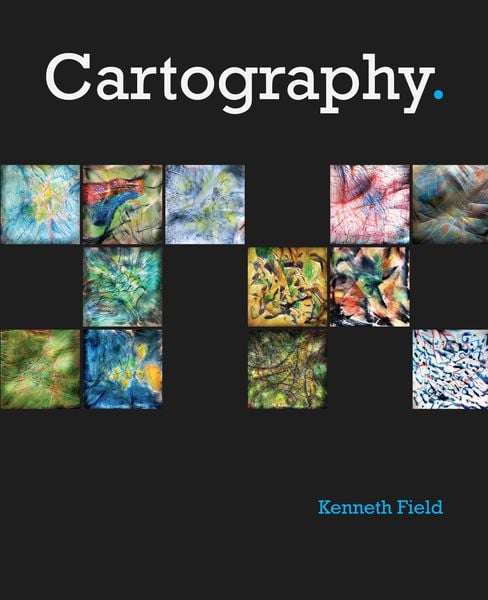
Produktbild: Cartography.

Cartography.

Fr. 88.90

inkl. gesetzl. MwSt., Versandkostenfrei


Beschreibung

Produktdetails

Einband

Taschenbuch

Erscheinungsdatum

28.06.2018

Abbildungen

mit Illustrationen

Verlag

Esri Press

Seitenzahl

576

Maße (L/B/H)

26.6/22/3.8 cm

Gewicht

2038 g

Sprache

Englisch

ISBN

978-1-58948-439-9

Beschreibung

Produktdetails

Einband

Taschenbuch

Erscheinungsdatum

28.06.2018

Abbildungen

mit Illustrationen

Verlag

Esri Press

Seitenzahl

576

Maße (L/B/H)

26.6/22/3.8 cm

Gewicht

2038 g

Sprache

Englisch

ISBN

978-1-58948-439-9

Herstelleradresse

Libri GmbH
Europaallee 1
36244 Bad Hersfeld
DE

Email: GPSR Kontakt

Noch keine Bewertungen vorhanden

Verfassen Sie die erste Bewertung zu diesem Artikel

Helfen Sie anderen Kundinnen und Kunden durch Ihre Meinung.
Kundinnen und Kunden meinen

Bewertungen (0)

  • Produktbild: Cartography.
  • "Introduction

    Making maps is easy
    Making great maps is hard

    1. Maps as Information Products

    The nature of an information product
    What is design?
    Trends in map design
    Functional design
    Designer, data and audience
    Engineers vs Designers vs Map Makers
    Simplicity and complexity
    Form and Function
    Dispersal and Layering
    Telling stories (metaphors and simile)
    Minimalism and efficiency
    Novelty or redundancy
    Data density
    Originality
    Emotional response
    Integrity
    Self-explanatory focus
    Wayfinding maps
    Experiential maps
    Numerical and statistical maps
    Production paradigms
    Viewing paradigms

    2. Perceptions and Conventions

    The way the eye and brain works
    Vizualising for the mind
    Logically coding points
    Pictograms vs Icons vs Symbols
    Logically coding lines
    Logically coding areas
    Connotations of form
    Connotations of colour
    Mixing and using colours
    Colour constraints
    Connotations of value
    Working in greyscale
    Connotations of typeface
    Labelling hierarchies
    Making connections on the map
    Consistent denotation
    Innovation and familiarity
    Compare and contrast
    Ways of seeing
    Navigating the page
    Navigating the screen
    Navigating the mobile device
    Factual understanding vs Interpretation

    3. Objective Dimensions

    Information overload
    Selection by feature type
    Selection by numbers
    Dimensional comparison
    Measurement of Earth
    Scale
    Distances
    Spheres and elipses
    Datums
    Latitude and longitude
    Geographic coordinates
    Projected coordinates
    Numerical integrity
    Making numbers meaningful
    Geographical distortions
    Projection distortions
    Projection families
    Choosing a good projection
    Compromising geographical form
    Geography as a diagram
    Measurement and proportions
    Absolute data
    Percentages, ratios and rates
    Comparatives
    Summarising data distributions
    Classifying data

    4. Structure and Organisation

    Dispersal vs Layering
    Grids in information design
    Organisation and response
    Generalising features
    Styling features
    Graphical hierarchies
    Contrast
    Actors and support cast
    Repetition
    Proximity
    Balance
    Staging hierarchies
    Which way is up?
    Signs and pointers
    Focussing attention
    Distractions
    Language and phraseology
    Choosing a font
    Serif
    Sans serif
    Font efficiency: width, height, size
    Font efficiency: structure, form, direction, colour
    Typeface differentiation
    Legibility
    Type placement
    The small print (marginalia)

    5. Pick’n’Map

    Choropleth
    Isarithmic
    Dot Density
    Binning
    Dasymetric
    Value by alpha
    Cartogram
    Flow
    Network mapping
    Schematic diagrams
    Isochrones
    Graduated Symbol
    Proportional Symbol
    Unique Values
    Bivariate mapping
    Multivariate mapping
    Embedded charts
    Small multiples
    Chernof Faces
    Proportional text

    6. Different viewpoints

    Planimetric
    Panoramic
    Isometric
    Aspect
    Prism maps
    3D isolines
    Mapping change
    Animation
    Dynamic variables
    Temporal

    7. Going digital – the UI/UX challenge

    Map Mashups
    The 2 second rule
    Resolution
    Size
    Performance
    Responsive maps
    Interaction
    Capabilities
    Native v Browser apps
    Partial attention
    Time and day
    Inputs
    Connectivity
    Currency
    Personalising the map experience
    User testing
    Eye tracking
    Wireframes
    Workflow
    Prototypes
    Development technologies