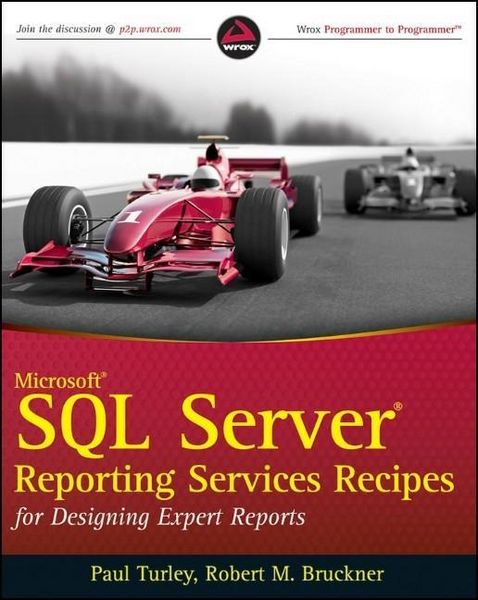
Microsoft SQL Server Reporting Services Recipes for Designing Expert Reports
-
- Englisch ausgewählt
Fr. 58.90
inkl. gesetzl. MwSt.,
Beschreibung
Produktdetails
Einband
Taschenbuch
Erscheinungsdatum
01.06.2010
Verlag
John Wiley & Sons IncSeitenzahl
648
Maße (L/B/H)
23.7/19/3.6 cm
Gewicht
1092 g
Auflage
1. Auflage
Sprache
Englisch
ISBN
978-0-470-56311-3
Learn to design more effective and sophisticated business reports
While most users of SQL Server Reporting Services are now comfortable designing and building simple reports, business today demands increasingly complex reporting. In this book, top Reporting Services design experts have contributed step-by-step recipes for creating various types of reports.
Written by well-known SQL Server Reporting Services experts, this book gives you the tools to meet your clients' needs
Coverage includes:
Business Reporting Paradigms
Basic Report Design Concepts
Using Report Builder.
Report Design Essentials
Tabular and Matrix Reports
Expressions and Custom Code
Formatting Report Data
Columnar and Grouped Reports
Bi Dashboards and Elements
Synchronizing Groups, Charts, and Sparklines
Chart and Gauge Reports
Creating a Personal Report Card
Creating a Multi-Series Multi-Y Axis Chart
Interactive Reporting
Integrated Reporting Applications
Offline Reporting Using The Report Viewer Control
Creating a Calendar Report
Creating Mailing Labels
Barcodes
Excel Worksheet Naming and Page Naming
External Image Sources
Language Localization
Creating a Checkbox List To Show Existing Records
Using a Checkbox List To Select and Deselect Records
Using The Map Wizard
Filtering and Parameterization
Multiple Criterion Report Filtering
Using Multi-Value Parameters with a Stored Procedure
Using Multi-Value Parameters with a Subscription Report
Creating Custom Sorting Reports
Filtering User-Specific Report Data
Custom and Dynamic Data Sources
Using a Web Service As a Data Source
Reporting On Sharepoint List Data
Dynamics Ax Report Wizard
and More!
The SQL Server Reporting Services Cookbook brings together great report designs that have been field-tested by the experts
Note: CD-ROM/DVD and other supplementary materials are not included as part of eBook file.
While most users of SQL Server Reporting Services are now comfortable designing and building simple reports, business today demands increasingly complex reporting. In this book, top Reporting Services design experts have contributed step-by-step recipes for creating various types of reports.
Written by well-known SQL Server Reporting Services experts, this book gives you the tools to meet your clients' needs
Coverage includes:
Business Reporting Paradigms
Basic Report Design Concepts
Using Report Builder.
Report Design Essentials
Tabular and Matrix Reports
Expressions and Custom Code
Formatting Report Data
Columnar and Grouped Reports
Bi Dashboards and Elements
Synchronizing Groups, Charts, and Sparklines
Chart and Gauge Reports
Creating a Personal Report Card
Creating a Multi-Series Multi-Y Axis Chart
Interactive Reporting
Integrated Reporting Applications
Offline Reporting Using The Report Viewer Control
Creating a Calendar Report
Creating Mailing Labels
Barcodes
Excel Worksheet Naming and Page Naming
External Image Sources
Language Localization
Creating a Checkbox List To Show Existing Records
Using a Checkbox List To Select and Deselect Records
Using The Map Wizard
Filtering and Parameterization
Multiple Criterion Report Filtering
Using Multi-Value Parameters with a Stored Procedure
Using Multi-Value Parameters with a Subscription Report
Creating Custom Sorting Reports
Filtering User-Specific Report Data
Custom and Dynamic Data Sources
Using a Web Service As a Data Source
Reporting On Sharepoint List Data
Dynamics Ax Report Wizard
and More!
The SQL Server Reporting Services Cookbook brings together great report designs that have been field-tested by the experts
Note: CD-ROM/DVD and other supplementary materials are not included as part of eBook file.
Noch keine Bewertungen vorhanden
Verfassen Sie die erste Bewertung zu diesem Artikel
Helfen Sie anderen Kundinnen und Kunden durch Ihre Meinung.