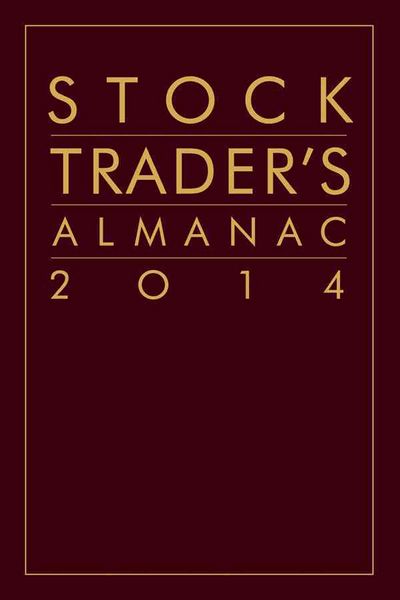
Stock Trader's Almanac 2014
Aus der Reihe
Stock Trader's Almanac
-
- Hardcover ausgewählt
- Taschenbuch
-
Sprache:Englisch
Fr. 58.90
inkl. gesetzl. MwSt.,
Beschreibung
Produktdetails
Einband
Gebundene Ausgabe
Verlag
John Wiley & Sons IncSeitenzahl
192
Maße (L/B/H)
22/15.7/2.2 cm
Gewicht
282 g
Auflage
10. Auflage
Sprache
Englisch
ISBN
978-1-118-65945-8
A time-tested guide to stock trading market cycles and seasonal trends
Published every year since 1968, the Stock Trader's Almanac is a practical investment tool with a wealth of information organized in calendar format. Everyone from well-known money managers to savvy traders and investors relies upon this annual resource for its in-depth analyses and insights. The Stock Trader's Almanac 2014 contains essential historical price information on the stock market, provides monthly and daily reminders, and highlights seasonal trading opportunities and dangers.
The STA is now bound with a lexitone cover and an attractive gold spiral with gold foil stamping. This new format is more user-friendly and lies flat when open, easier for making notes. It is also lighter and more portable. This version harkens back to the original STA format that Yale Hirsch pioneered over 40 years ago.
The Stock Trader's Almanac 2014 is packed with timely insights and targeted analysis to help you navigate turbulent markets and beat the odds in the year ahead. This trusted guide combines over a century's worth of data, statistics, and trends along with vital analysis you won't get anywhere else.
Alerts you to little-known market patterns and tendencies to help forecast market trends with accuracy and confidence
An indispensable annual resource, trusted for over 40 years by traders and investors
The data in the Almanac is some of the best in the business
For its wealth of information and the authority of its sources, the Stock Trader's Almanac stands alone as the guide to intelligent investing.
Published every year since 1968, the Stock Trader's Almanac is a practical investment tool with a wealth of information organized in calendar format. Everyone from well-known money managers to savvy traders and investors relies upon this annual resource for its in-depth analyses and insights. The Stock Trader's Almanac 2014 contains essential historical price information on the stock market, provides monthly and daily reminders, and highlights seasonal trading opportunities and dangers.
The STA is now bound with a lexitone cover and an attractive gold spiral with gold foil stamping. This new format is more user-friendly and lies flat when open, easier for making notes. It is also lighter and more portable. This version harkens back to the original STA format that Yale Hirsch pioneered over 40 years ago.
The Stock Trader's Almanac 2014 is packed with timely insights and targeted analysis to help you navigate turbulent markets and beat the odds in the year ahead. This trusted guide combines over a century's worth of data, statistics, and trends along with vital analysis you won't get anywhere else.
Alerts you to little-known market patterns and tendencies to help forecast market trends with accuracy and confidence
An indispensable annual resource, trusted for over 40 years by traders and investors
The data in the Almanac is some of the best in the business
For its wealth of information and the authority of its sources, the Stock Trader's Almanac stands alone as the guide to intelligent investing.
Noch keine Bewertungen vorhanden
Verfassen Sie die erste Bewertung zu diesem Artikel
Helfen Sie anderen Kundinnen und Kunden durch Ihre Meinung.