KI-Beratung Beta

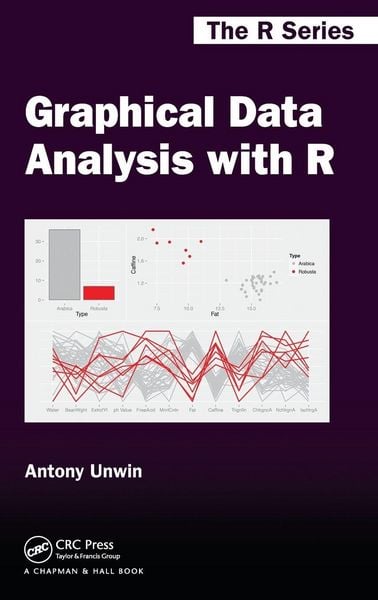
Produktbild: Graphical Data Analysis with R

Graphical Data Analysis with R

Fr. 94.90

inkl. gesetzl. MwSt., Versandkostenfrei


Beschreibung

See How Graphics Reveal Information Graphical Data Analysis with R shows you what information you can gain from graphical displays. The book focuses on why you draw graphics to display data and which graphics to draw (and uses R to do so). Graphical data analysis is useful for data cleaning, exploring...

Beschreibung

See How Graphics Reveal Information Graphical Data Analysis with R shows you what information you can gain from graphical displays. The book focuses on why you draw graphics to display data and which graphics to draw (and uses R to do so). Graphical data analysis is useful for data cleaning, exploring data structure, detecting outliers and unusual groups, identifying trends and clusters, spotting local patterns, evaluating modelling output, and presenting results. This book guides you in choosing graphics and understanding what information you can glean from them. It can be used as a primary text in a graphical data analysis course or as a supplement in a statistics course. Colour graphics are used throughout.

Produktdetails

Einband

Gebundene Ausgabe

Erscheinungsdatum

20.05.2015

Abbildungen

farbige Illustrationen, Tabellen, schwarz-weiss

Verlag Taylor and Francis

Produktdetails

Einband

Gebundene Ausgabe

Erscheinungsdatum

20.05.2015

Abbildungen

farbige Illustrationen, Tabellen, schwarz-weiss

Verlag Taylor and Francis
Seitenzahl

312

Maße (L/B/H)

24/16.1/2.1 cm

Gewicht

584 g

Sprache

Englisch

ISBN

978-1-4987-1523-2

Herstelleradresse

Libri GmbH
Europaallee 1
36244 Bad Hersfeld
DE

Email: gpsr@libri.de

Noch keine Bewertungen vorhanden

Verfassen Sie die erste Bewertung zu diesem Artikel

Helfen Sie anderen Kundinnen und Kunden durch Ihre Meinung.

Kundinnen und Kunden meinen

Bewertungen (0)

Die Leseprobe wird geladen.
  • Produktbild: Graphical Data Analysis with R