Statistical Methods for Geography A Student's Guide
-
- Hardcover
- Taschenbuch ausgewählt
- eBook
-
Sprache:Englisch
Fr. 66.90
inkl. gesetzl. MwSt.,
Beschreibung
Produktdetails
Verkaufsrang
38336
Einband
Taschenbuch
Erscheinungsdatum
18.12.2019
Verlag
Sage PublicationsSeitenzahl
432
Maße (L/B/H)
23.2/18.6/2.7 cm
Gewicht
1000 g
Auflage
5. Auflage
Sprache
Englisch
ISBN
978-1-5264-9880-9
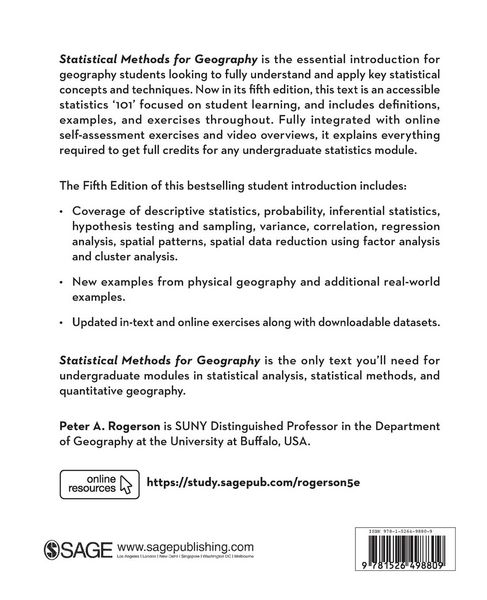
Statistical Methods for Geography is the essential introduction for geography students looking to fully understand and apply key statistical concepts and techniques. Now in its fifth edition, this text is an accessible statistics 101 focused on student learning, and includes definitions, examples, and exercises throughout. Fully integrated with online self-assessment exercises and video overviews, it explains everything required to get full credits for any undergraduate statistics module.
The fifth edition of this bestselling text includes:
· Coverage of descriptive statistics, probability, inferential statistics, hypothesis testing and sampling, variance, correlation, regression analysis, spatial patterns, spatial data reduction using factor analysis and cluster analysis.
· New examples from physical geography and additional real-world examples.
· Updated in-text and online exercises along with downloadable datasets.
This is the only text you ll need for undergraduate courses in statistical analysis, statistical methods, and quantitative geography.
Noch keine Bewertungen vorhanden
Verfassen Sie die erste Bewertung zu diesem Artikel
Helfen Sie anderen Kundinnen und Kunden durch Ihre Meinung.