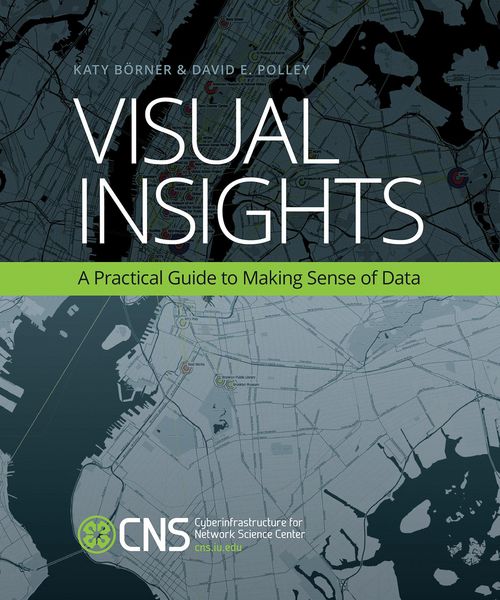
Visual Insights A Practical Guide to Making Sense of Data
-
- Englisch ausgewählt
Fr. 69.90
inkl. gesetzl. MwSt.,
Beschreibung
Produktdetails
Einband
Taschenbuch
Altersempfehlung
18 - 99 Jahr(e)
Erscheinungsdatum
24.01.2014
Verlag
Mit PressSeitenzahl
312
Maße (L/B/H)
22.8/18.9/2 cm
Gewicht
726 g
Sprache
Englisch
ISBN
978-0-262-52619-7
In the age of Big Data, the tools of information visualization offer us a macroscope to help us make sense of the avalanche of data available on every subject. This book offers a gentle introduction to the design of insightful information visualizations. It is the only book on the subject that teaches nonprogrammers how to use open code and open data to design insightful visualizations. Readers will learn to apply advanced data mining and visualization techniques to make sense of temporal, geospatial, topical, and network data.
The book, developed for use in an information visualization MOOC, covers data analysis algorithms that enable extraction of patterns and trends in data, with chapters devoted to “when” (temporal data), “where” (geospatial data), “what” (topical data), and “with whom” (networks and trees); and to systems that drive research and development. Examples of projects undertaken for clients include an interactive visualization of the success of game player activity in World of Warcraft; a visualization of 311 number adoption that shows the diffusion of non-emergency calls in the United States; a return on investment study for two decades of HIV/AIDS research funding by NIAID; and a map showing the impact of the HiveNYC Learning Network.
Visual Insights will be an essential resource on basic information visualization techniques for scholars in many fields, students, designers, or anyone who works with data.
Noch keine Bewertungen vorhanden
Verfassen Sie die erste Bewertung zu diesem Artikel
Helfen Sie anderen Kundinnen und Kunden durch Ihre Meinung.